How to find an approximation of the differential coefficient and draw a tangent line(JavaScript)
If you’re a math teacher, you might want to create a graph with the code you wrote and show it to your students. If you use JavaScript, all you need is a browser and a text editor.
In this post, we’ll learn how to create graphs in JavaScript. We’ll also write code to calculate an approximation of the differential coefficient.
Function definition
let f = e => {
const y = e*e;
return y;
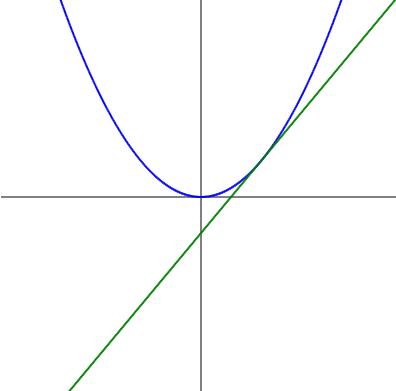
};The function $f(x)=x^2$ is defined.
When $x=2$, then $f(x)=4$.
let fd = e => {
    const h = 0.001;
    const yd = (f(t+h)-f(t))/h;
    const y = yd*(e-t)+f(t);
    return y;
};
The function fd(x) is defined. It computes an approximation to the differential coefficient of $f(x)$ and returns the y-coordinate of the tangent line.
The differential coefficient can be calculated with the following formula.
$$\displaystyle f'(x)=\lim_{h\rightarrow0}\cfrac{f(x+h)-f(x)}{h}$$
The closer $h$ is to zero, the more accurate the approximation of the differential coefficient becomes. Here, a small value of h=0.001 is set.
And the tangent line is defined by the following equation.
$y=f'(t)(x-t)+f(t)$
Drawing Graphs
const t = 0.6;Draws a tangent line at a point with an x-coordinate of 0.6.
const range = 4;The range of the graph is defined; range=4 means that the graph will be drawn in the x-coordinate range of -2 to 2.
let x = -range/2;-range/2=-2. The value of x varies from -2 to 2 and the graph is drawn.
document.write('<svg width=400 height=400><svg width=400 height=400> sets the size of the canvas to 400 pixels.
<line x1=0 y1=200 x2=400 y2=200 stroke="black"/>
<line x1=200 y1=0 x2=200 y2=400 stroke="black"/>');
A straight line on the x and y axes is drawn.
for(let i=0; i < 400; i++) {The curve consists of 400 short lines. The for statement iterates over a short line 400 times.
document.write('<g transform="translate(200,200)scale('+(400/range)+', '+(-400/range)+')"><line x1='+x+' y1='+f(x)+' x2='+(x+range/400)+' y2='+f(x+range/400)+' stroke="blue" stroke-width="'+range/400*2+'" /></g>');The curve $y=f(x)$ is drawn. translate(200,200) sets the center coordinates of the canvas to (0,0).
scale() sets the scale of the canvas. The direction of y-axis is opposite in math graphs and canvases. When the graph is drawn, you’ll find the graph upside-down. So, when the y-axis is set to a negative value, the direction of the y-axis is what you want it to be.
<line> draws a straight line with two coordinates. Imagine 400 points on a curve. A short straight line is drawn between one point on the curve and its neighbors.
document.write('<g transform="translate(200,200)scale('+(400/range)+', '+(-400/range)+')"><line x1='+x+' y1='+fd(x)+' x2='+(x+range/400)+' y2='+fd(x+range/400)+' stroke="green" stroke-width="'+range/400*2+'" /></g>');A tangent line is drawn. The tangent line also consists of 400 short lines. Tangent lines are not necessarily drawn this way, but it’s easier to use the same method for curves.
x += range/400;The value of x is added and for move to the next straight line.
Here is the overall code.
<!DOCTYPE html><html><body><script>
let f = e => {
    const y = e*e;
    return y;
};
let fd = e => {
    const h = 0.001;
    const yd = (f(t+h)-f(t))/h;
    const y = yd*(e-t)+f(t);
    return y;
};
const t = 0.6;
const range = 4;
let x = -range/2;
document.write('<svg width=400 height=400><line x1=0 y1=200 x2=400 y2=200 stroke="black"/><line x1=200 y1=0 x2=200 y2=400 stroke="black"/>');
for(let i=0; i < 400; i++) {
    document.write('<g transform="translate(200,200)scale('+(400/range)+', '+(-400/range)+')"><line x1='+x+' y1='+f(x)+' x2='+(x+range/400)+' y2='+f(x+range/400)+' stroke="blue" stroke-width="'+range/400*2+'" /></g>');
    document.write('<g transform="translate(200,200)scale('+(400/range)+', '+(-400/range)+')"><line x1='+x+' y1='+fd(x)+' x2='+(x+range/400)+' y2='+fd(x+range/400)+' stroke="green" stroke-width="'+range/400*2+'" /></g>');
    x += range/400;
};
document.write('</svg>');
</script></body></html>SNSでシェア