【PHP】svgで暗号通貨のチャートに時間や価格の基準線を加える
前回,【PHP】暗号通貨のローソク足チャートをsvgで出力するで,暗号通貨のローソク足を出力しました。今回は画面にもう少し情報を付け加えていきたいと思います。
配色の変更
<style type="text/css">body{color:#fff;background-color:#000;}
    line{shape-rendering:crispEdges;}</style>
スタイルシートを指定して画面の背景を黒に,文字の色を白にします。特に深い意味はありませんが,こちらの方が見た目がそれっぽい気がします。また shape-rendering:crispEdges は直線の縁をくっきりとさせます。
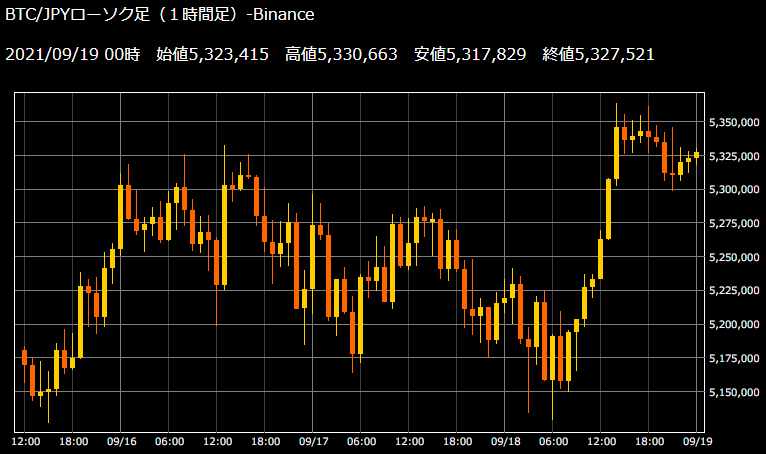
今回出力しようとしているチャートは上のようになります。ローソク足が色分けされ,時間や価格の情報が加わりました。
チャートの描画
$ct = [
    "width" => 800,
    "height" => 400,
    "margin" => [
        "top" => 10,
        "right" => 100,
        "bottom" => 50,
        "left" => 10
    ],
    "padding" => 10,
    "unit" => 25000
];
チャートを描画する上で必要な情報を連想配列 ct にまとめておきます。時間や価格の情報を表示するため,マージンの情報は上下左右で異なる値を用いています。
unit は価格の区切り線を表示する際の単位です。ここでは 25000 円ごとに区切り線を入れます。
枠線の描画
echo "<rect x='", $ct["margin"]["left"], "' y='", $ct["margin"]["top"],
    "' width='", $ct["width"] - $ct["margin"]["left"] - $ct["margin"]["right"],
    "' height='", $ct["height"] - $ct["margin"]["top"] - $ct["margin"]["bottom"],
    "' stroke='#FFFFFF' stroke-width='1' fill='none'/>";
枠線を描きます。描画領域から上下左右のマージンを引いて枠線を描きます。
時間の基準線の描画
for ($i = 0; $i < 85; $i++){
    $unixtime = strtotime('-1 hour', $candlestick["result"][3600][$start + $i][0]);
    if ((int) date("H", $unixtime) % 6 == 0) {
        $x = $i * 8 + $ct["margin"]["left"] + $ct["padding"];
        echo "<line x1='", $x, "' y1='", $ct["margin"]["top"], "' x2='", $x, "'
        y2='", $ct["height"] - $ct["margin"]["bottom"],
        "' stroke='#808080' stroke-width='1'/>";
        if ((int) date("H", $unixtime) == 0) {
            echo "<text x='", $x - 14, "' y='", $ct["height"] - $ct["margin"]["bottom"] + 12,
            "' font-size='10' fill='#FFFFFF'>", date("m/d", $unixtime), "</text>";
        } else {
            echo "<text x='", $x - 14, "' y='", $ct["height"] - $ct["margin"]["bottom"] + 12,
            "' font-size='10' fill='#FFFFFF'>", date("H:00", $unixtime), "</text>";
        }
    }
}
6 時間ごとに直線を引きます。今回は 85 本のローソク足を描画しますが,それぞれのローソク足の時間が 6 の倍数のときに基準線と文字を描画する仕組みです。
$unixtime = strtotime('-1 hour', $candlestick["result"][3600][$start + $i][0]);ローソク足のデータ $candlestick から UNIX 時間を抽出します。UNIX 時間は終了時間を表しているので,1 時間ずらして開始時間を取得します。
if ((int) date("H", $unixtime) % 6 == 0) {ローソク足の時間が 6 の倍数であれば基準線と文字を描画します。date()は文字列を返すので,変数の前に(int)をつけて数値に変換します。% 6 は 6 で割った余りを求めます。ある数を 6 で割った余りが 0 ならその数は 6 の倍数です。
$x = $i * 8 + $ct["margin"]["left"] + $ct["padding"];基準線の x 座標を求めます。ローソク足は水平方向に 8 px ずつ移動しながら描画していきます。そこに,マージンとパッディングの値を足して,位置を調整します。
        echo "<line x1='", $x, "' y1='", $ct["margin"]["top"], "' x2='", $x, "'
        y2='", $ct["height"] - $ct["margin"]["bottom"],
        "' stroke='#808080' stroke-width='1'/>";
基準線を引きます。
        if ((int) date("H", $unixtime) == 0) {
            echo "<text x='", $x - 14, "' y='", $ct["height"] - $ct["margin"]["bottom"] + 12,
            "' font-size='10' fill='#FFFFFF'>", date("m/d", $unixtime), "</text>";
        } else {
            echo "<text x='", $x - 14, "' y='", $ct["height"] - $ct["margin"]["bottom"] + 12,
            "' font-size='10' fill='#FFFFFF'>", date("H:00", $unixtime), "</text>";
}<text>を用いて日時を表す文字を描画します。座標に -14 や +12 が加えられているのは表示位置の微調整のためです。時刻が 0 時のときには m/d で日付を描画し,6,12,18 時のときは H:00 でそれぞれの時刻を描画しています。
価格線の描画
$price = $min - ($min % $ct["unit"]) + $ct["unit"];
while ($price < $max) {
    $y = ($max - $price) * $scale + $ct["margin"]["top"] + $ct["padding"];
    echo "<line x1='", $ct["margin"]["left"], "' y1='", $y,
        "' x2='", $ct["width"] - $ct["margin"]["right"], "' y2='", $y,
        "' stroke='#808080' stroke-width='1'/>";
    echo "<text x='", $ct["width"] - $ct["margin"]["right"] + 4, "' y='", $y + 4,
        "' font-size='10' fill='#FFFFFF'>", number_format($price), "</text>";
    $price += $ct["unit"];
}
価格を表す水平方向の基準線を描画します。時間の基準線を引いたときとは少しやり方を変えていかなければなりません。まず,最初に線を引くべき価格を $price に格納し,価格を加算しながら直線を引いていきます。あとはこの作業を $price がグラフの上端の価格 $max を上回るまで繰り返します。
$price = $min - ($min % $ct["unit"]) + $ct["unit"];25000 円ごとに直線を引いていきます。$min はグラフの下端の価格です。
例えば,$min が 5,371,234 円だとします。これを 25000 で割った余りを求めると,21,234 となります。引き算すると 5,371,234 - 21,234 = 5,350,000 となり,基準線を引くべき 25,000 円単位の価格が求められます。ただし,この値はグラフの下端よりもさらに下にあるので 25,000 を足して 5,375,000 とし,基準線を引く最初の価格とします。
$y = ($max - $price) * $scale + $ct["margin"]["top"] + $ct["padding"];価格をもとに y 座標を求めます。
    echo "<line x1='", $ct["margin"]["left"], "' y1='", $y,
        "' x2='", $ct["width"] - $ct["margin"]["right"], "' y2='", $y,
        "' stroke='#808080' stroke-width='1'/>";
直線を引きます。x 座標は描画領域からマージン部分を差し引いた座標を用います。
    echo "<text x='", $ct["width"] - $ct["margin"]["right"] + 4, "' y='", $y + 4,
        "' font-size='10' fill='#FFFFFF'>", number_format($price), "</text>";
文字を描画します。描画位置の微調整のため,座標に +4 を加えています。number_format($price) とすると,$price を 3 桁区切りの整数として表示することができます。
$price += $ct["unit"];最後に価格に $ct["unit"] (=25000) を加えて,次に引くべき基準線の価格を求めておきます。
チャートの描画
チャートの描画部分ついては以前と変わりないので,前回までの記事を参照してください。
まとめ
ここでは,暗号通貨のチャートに時間や価格を表す基準線を入れる方法を学びました。ここではなるべくシンプルに基準線を引いているため,十分フレキシブルとは言えません。刻々と変化する価格の情報をもとに,もっと柔軟性のあるチャートを表示する工夫をしてみると良いでしょう。
最後に,コード全体を示します。
<!DOCTYPE html>
<html lang="ja">
<head>
<meta charset="utf-8">
<style type="text/css">body{color:#fff;background-color:#000;}
    line{shape-rendering:crispEdges;}</style>
</head>
<body>
<?php
//Bitcoinの1時間足を取得する
$url = "https://api.cryptowat.ch/markets/binance/btcusdt/ohlc?periods=3600";
$ch = curl_init();
curl_setopt($ch, CURLOPT_URL, $url); //URLを指定
curl_setopt($ch, CURLOPT_RETURNTRANSFER, true); //データを文字列で受け取る
$res = curl_exec($ch);
curl_close($ch);
$candlestick = json_decode($res, true);
//為替を取得する
$url = "https://www.gaitameonline.com/rateaj/getrate";
$ch = curl_init();
curl_setopt($ch, CURLOPT_URL, $url);
curl_setopt($ch, CURLOPT_RETURNTRANSFER, true);
$res = curl_exec($ch);
curl_close($ch);
$exchange = json_decode($res, true);
$usdjpy = $exchange["quotes"][20]["open"];
?>
<p>BTC/JPYローソク足(1時間足)-Binance</p>
<?php
date_default_timezone_set('Asia/Tokyo');
$unixtime = strtotime('-1 hour', $candlestick["result"][3600][999][0]);
echo date('<p>Y/m/d H時 ', $unixtime);
echo "始値", number_format($candlestick["result"][3600][999][1] * $usdjpy);
echo " 高値", number_format($candlestick["result"][3600][999][2] * $usdjpy);
echo " 安値", number_format($candlestick["result"][3600][999][3] * $usdjpy);
echo " 終値", number_format($candlestick["result"][3600][999][4] * $usdjpy);
echo "</p>";
//チャートの描画
$ct = [
    "width" => 800,
    "height" => 400,
    "margin" => [
        "top" => 10,
        "right" => 100,
        "bottom" => 50,
        "left" => 10
    ],
    "padding" => 10,
    "unit" => 25000
];
echo "<svg xmlns='http://www.w3.org/2000/svg'";
echo "viewBox='0 0 ", $ct["width"], " ", $ct["height"],
    "' width='", $ct["width"], "' height='", $ct["height"], "'>";
//枠線の描画
echo "<rect x='", $ct["margin"]["left"], "' y='", $ct["margin"]["top"],
    "' width='", $ct["width"] - $ct["margin"]["left"] - $ct["margin"]["right"],
    "' height='", $ct["height"] - $ct["margin"]["top"] - $ct["margin"]["bottom"],
    "' stroke='#FFFFFF' stroke-width='1' fill='none'/>";
//y軸方向の範囲を求める
$start = 915; //配列の何番目から描画するか
$prices = array();
for ($i = 0; $i < 85; $i++) {
    $high = $candlestick["result"][3600][$start + $i][2] * $usdjpy; //高値
    $low = $candlestick["result"][3600][$start + $i][3] * $usdjpy; //安値
    $open = $candlestick["result"][3600][$start + $i][1] * $usdjpy; //始値
    $close = $candlestick["result"][3600][$start + $i][4] * $usdjpy; //終値
    array_push($prices, $high, $low, $open, $close);
}
$max = max($prices);
$min = min($prices);
$scale = ($ct["height"] - $ct["margin"]["top"]
    - $ct["margin"]["bottom"] - ($ct["padding"] * 2))/($max-$min);
//基準線の描画
//時間線
for ($i = 0; $i < 85; $i++){
    $unixtime = strtotime('-1 hour', $candlestick["result"][3600][$start + $i][0]);
    if ((int) date("H", $unixtime) % 6 == 0) {
        $x = $i * 8 + $ct["margin"]["left"] + $ct["padding"];
        echo "<line x1='", $x, "' y1='", $ct["margin"]["top"], "' x2='", $x, "'
        y2='", $ct["height"] - $ct["margin"]["bottom"],
        "' stroke='#808080' stroke-width='1'/>";
        if ((int) date("H", $unixtime) == 0) {
            echo "<text x='", $x - 14, "' y='", $ct["height"] - $ct["margin"]["bottom"] + 12,
            "' font-size='10' fill='#FFFFFF'>", date("m/d", $unixtime), "</text>";
        } else {
            echo "<text x='", $x - 14, "' y='", $ct["height"] - $ct["margin"]["bottom"] + 12,
            "' font-size='10' fill='#FFFFFF'>", date("H:00", $unixtime), "</text>";
        }
    }
}
//価格線
$price = $min - ($min % $ct["unit"]) + $ct["unit"];
while ($price < $max) {
    $y = ($max - $price) * $scale + $ct["margin"]["top"] + $ct["padding"];
    echo "<line x1='", $ct["margin"]["left"], "' y1='", $y,
        "' x2='", $ct["width"] - $ct["margin"]["right"], "' y2='", $y,
        "' stroke='#808080' stroke-width='1'/>";
    echo "<text x='", $ct["width"] - $ct["margin"]["right"] + 4, "' y='", $y + 4,
        "' font-size='10' fill='#FFFFFF'>", number_format($price), "</text>";
    $price += $ct["unit"];
}
//描画
for($i = 0; $i < 85; $i++) {
    $high = $candlestick["result"][3600][$start + $i][2] * $usdjpy; //高値
    $low = $candlestick["result"][3600][$start + $i][3] * $usdjpy; //安値
    $open = $candlestick["result"][3600][$start + $i][1] * $usdjpy; //始値
    $close = $candlestick["result"][3600][$start + $i][4] * $usdjpy; //終値
    if ($open <= $close) {
        $color = "#FFCC00";
    } else {
        $color = "#FF6600";
    }
    $x = $i * 8 + $ct["margin"]["left"] + $ct["padding"];   //x座標
    $y1 = ($max - $high) * $scale + $ct["margin"]["top"] + $ct["padding"]; //高値のy座標
    $y2 = ($max - $low) * $scale + $ct["margin"]["top"] + $ct["padding"]; //安値のy座標
    echo "<line x1='", $x, "' y1='", $y1, "' x2='", $x,
        "' y2='", $y2, "' stroke='", $color, "' stroke-width='1'/>";
    $y1 = ($max - $open) * $scale + $ct["margin"]["top"] + $ct["padding"]; //始値のy座標
    $y2 = ($max - $close) * $scale + $ct["margin"]["top"] + $ct["padding"]; //終値のy座標
    echo "<line x1='", $x, "' y1='", $y1, "' x2='", $x,
        "' y2='", $y2, "' stroke='", $color, "' stroke-width='5'/>";
}
echo "</svg>";
?>
</body>
</html>SNSでシェア